TL/DR: no. But you can make your life at least a bit easier with the right tooling.
I heard this question a few times from my colleagues, so I’ll drop a short post with my answer for a wider audience 🙂
Many coders I know tend to avoid tasks where they need to change something in Azure Pipelines. I think I understand that instinct. This area is unfamiliar for most .NET or front-end coders. There is a steep learning curve to start. YAML format is controversial. There are no code suggestions that would be on par with Visual Studio’s IntelliSense. The native languages used in pipelines are bash and PowerShell, often unfamiliar.
And the last problem: no one likes to write the code that cannot be debugged locally. Instead, it looks like it needs to be pushed to git repo whenever you want to test something. Then we need to wait for feedback until it runs, so learning by trial-and-error is harder.
This article explains how I learned to deal with it. I use Azure DevOps quite often for about 3 years now, and I learned to like it.
Debugging a DevOps pipeline on your local machine
Sorry to disappoint you, but you won’t be able to debug the pipeline on your local machine. Or at least: not in a way you are familiar with if you expected to place breakpoints, step through the code line-by-line, or inspect the state of variables in some IDE.
Firstly, Pipelines are described in a declarative code, a bit similar to how HTML describes page layout or how SQL describes queries. This contrasts with mostly imperative languages like C# where you describe line-by-line what the application is supposed to do. You wouldn’t expect to place breakpoints in HTML document and step through it line-by-line, because it would not make sense. It’s the same with pipelines.
Secondly, the pipeline is just a glue for smaller building blocks, tasks, which are diverse in how they work and what technologies they use. Some of them execute iterative code (e.g. PowerShell scripts, Windows batch scripts, Linux bash scripts, JavaScript applications). Those technologies are diverse, and I think it would require a very complex IDE/debugger to provide a unified debugging experience. But some tasks just wrap some binary executable (e.g. Azure CLI) and there would be nothing debuggable in the traditional sense.
Thirdly, in DevOps pipelines, context is everything. Tasks have many built-in assumptions about the environment, like what programs are installed on the agent executing the pipeline. Pipelines often connect to external service, for example to deploy resources to Azure. To make that happen, they must be executed in a context of a user who has permissions to perform actions. Or a pipeline might take artifacts from another pipeline as an input. All such context is carefully configured in DevOps with use of features like Service Connections, Library (of variable groups) and other.
How to improve your experience working with DevOps pipelines
The above arguments might sound that there is no hope. But even if you cannot debug your pipeline as a whole, here are some hints that can make your life easier:
Use Windows Subsystem for Linux (WSL)
If you write some bash scripts, you should certainly try debugging them locally. It sounds like a hell to write a bash script, and only test it after pushing to git and looking at pipeline logs.
If you use Windows, you can install Windows Subsystem For Linux feature and run your scripts on your local machine without much hassle.
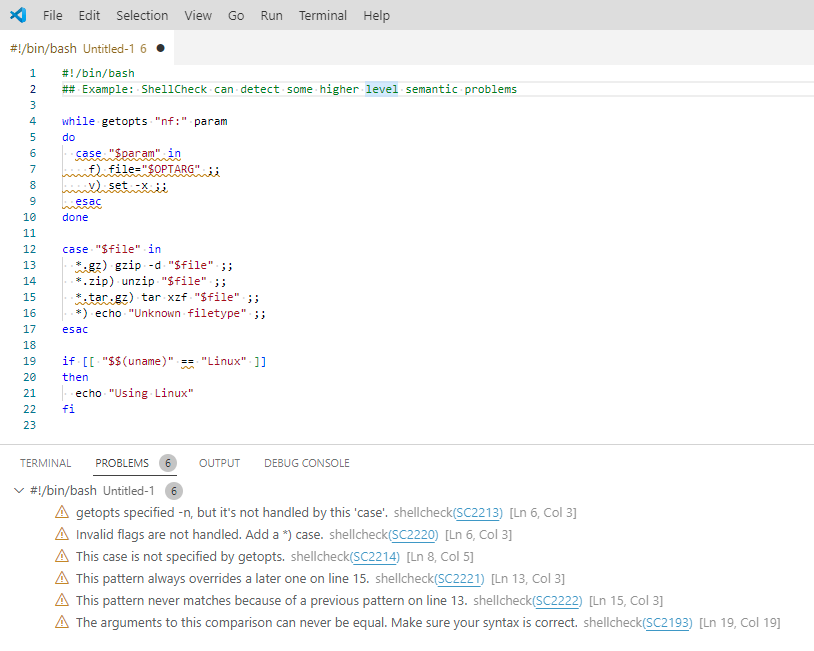
Get a proper IDE support if you write bash or PowerShell scripts
We normally use IDEs like Visual Studio Professional or Rider that cost hundreds of dollars a year to get the best developer experience available. But it appears as if developers forgot about all of that when they need to code in bash, and they try to scribble some scripts in Notepad or similar.
Invest some time and get proper IDE and extensions to support you. For example, VS Code has good extensions to develop bash (see ShellCheck) and Powershell.
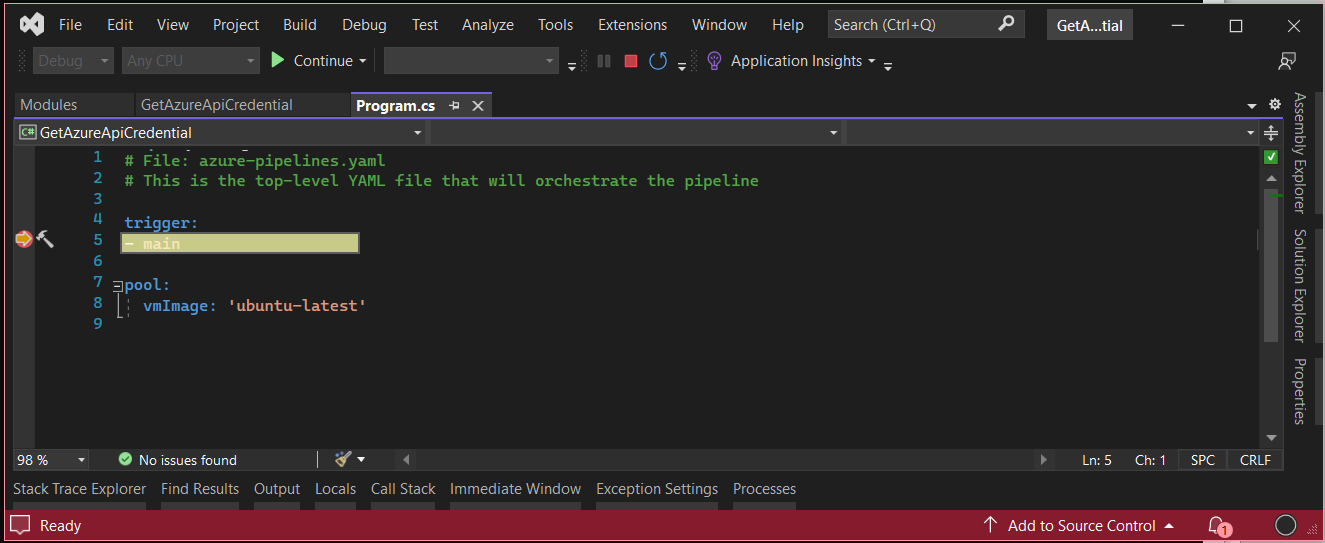
Use VS Code and Azure Pipelines extension to develop YAML pipelines
The Azure Pipelines extension provides syntax highlighting and IntelliSense for YAML pipelines. You might need to fine-tune Visual Studio settings, because by default it will often auto-detect the file type as generic “YAML” and not “Azure Pipelines”.
Comment out (temporarily) parts of pipeline that are irrelevant to what you do
Sometimes you will need to test your code in a real DevOps environment. You can work on a git branch and run the pipeline from there. If there are parts of the pipeline irrelevant to what you do, you can try commenting them out. From my experience, test runs of pipelines will just happen many times during development. It’s part of the job.
If you can think of any good hints on how to make pipeline development easier, please share with us in the comments!
No comments yet, you can leave the first one!