Here’s a short observation that surprised me in the recent days. I just want to leave a note in case anyone stumbles upon similar issue.
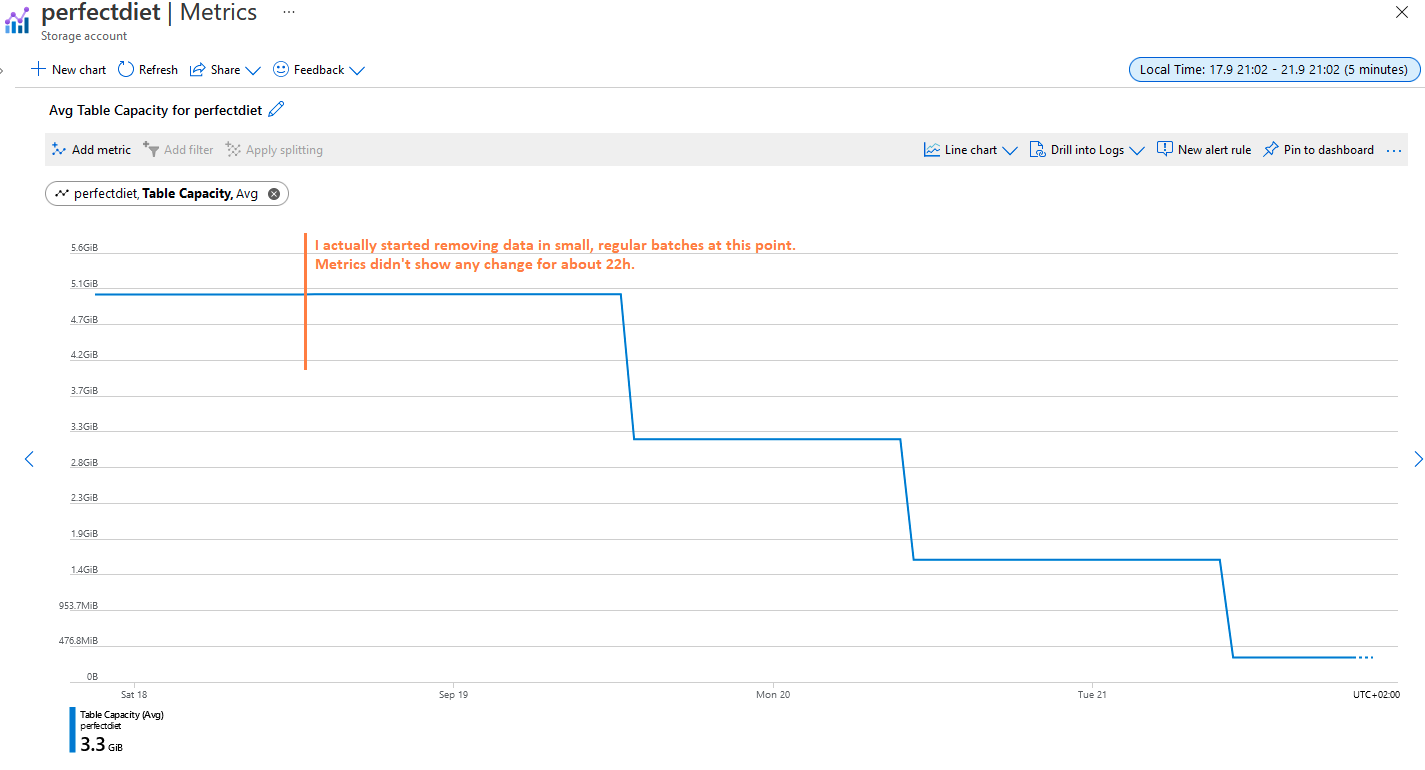
I noticed that metrics for Azure Storage like Table Capacity and Table Entity Count show data which isn’t too accurate. Let’s see a simple case where I started migrating & removing data at some point. I expected a linear chart going from 5.1 GB when I start to 0 GB when I finish. But I got this:

I found it a bit surprising because I expected that observing such metrics would be the best way to monitor progress of a process like data migrating data to another storage. So, what happened here?
I see two things here:
- A delay of about 24 hours. I found in documentation that, indeed, Azure refreshes those metrics daily. If that’s intentional, it’s ok.
- A granularity of 1 hour. This one seems weird to me. If we know that Azure updates the metric only once a day, why pretend that we have value every hour, and not just leave much fewer data points where we have actual results? The chart would be more accurate if we just connected the points where we have data and interpolated the unknown data in between.
I wanted to dig deeper on that to understand, but the explanation in official docs didn’t clarify it for me. I therefore created a GitHub issue and asked for a better explanation.
So far, it’s sitting in the queue, so unfortunately I don’t have an explanation for whether it makes sense. But there is a chance that soon the thread will lead to a better explanation of how those metrics behave. 🙂


I have been clearing out a ton of old diagnostic records and found the same thing! I was confused as to why the used capacity was completely unchanged after the operations until I saw the refresh the next day.