Optimizely CMS 12 status: debugging symbols are not available
When working with a programming framework, we sometimes stumble upon unexpected behaviors. Sometimes, issues can be solved with documentation. Other times, we might want to debug the framework’s behavior.
Optimizely CMS (formerly Episerver) used to publish source symbols for the platform, but according to the official Troubleshooting page, symbols are no longer published for new versions like CMS 12.
Decompiling CMS DLLs to inspect source code
Let’s examine what the lack of symbols means to developers who use the Optimizely CMS framework to build their applications.
I cloned the Optimizely project templates and created a project using the epi-alloy-mvc template to see how Visual Studio behaves by default. To work on a concrete example, let’s arbitrarily assume that we want to inspect CMS’s code related to commonly used property type—XhtmlString.
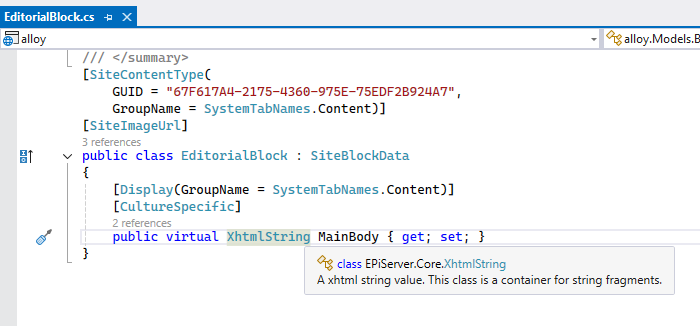
When I use “Go to definition” (F12) on that type, Visual Studio decompiles the code and navigates to it.

When I started writing this blog post, I didn’t expect decompilation to automatically happen because I was used to setting up JetBrains dotTrace specifically for this purpose. But now I see that decompilation with ILSpy was added to Visual Studio 2019 some time ago. What a nice feature! So, we can read the code but cannot set breakpoints yet.
Using Visual Studio debugger to step into the CMS code
So far, so good: we can see some code without official symbols published. The C# code’s quality seems quite good despite being produced by a decompiler. But can we take it further and place working breakpoints in the Optimizely CMS code?
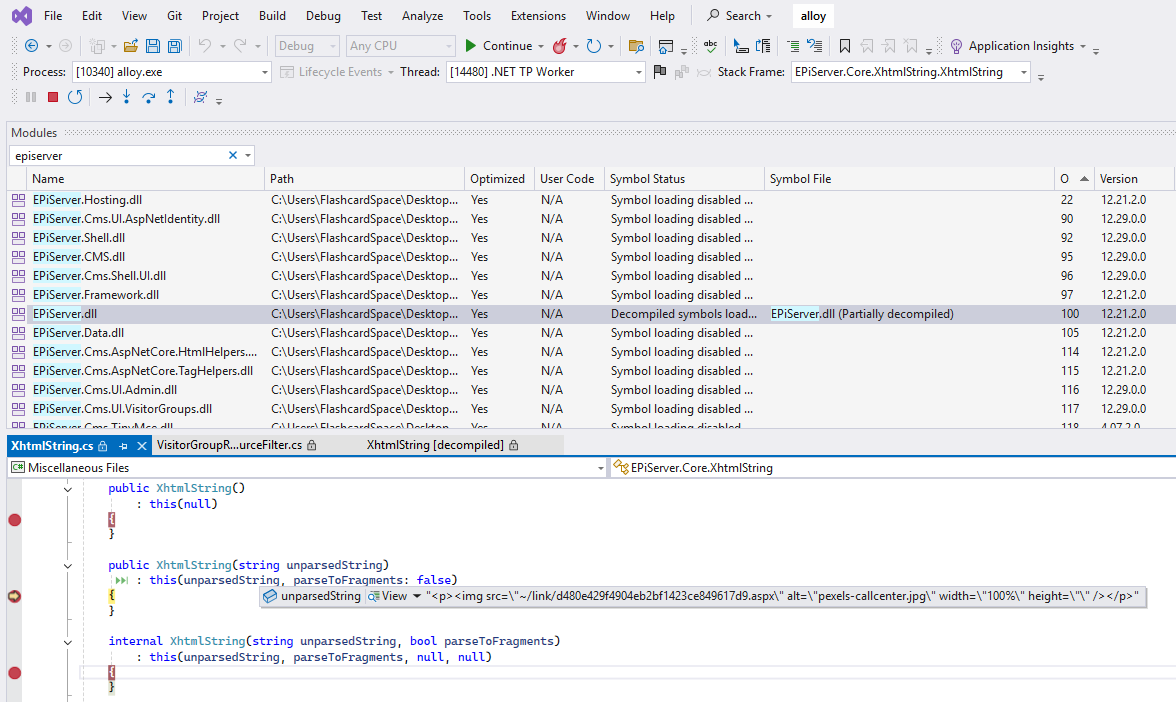
Option 1: use built-in ILSpy decompiler
To try, I changed the default Visual Studio setting:
- Options -> Debugging -> General -> Enable Just My Code (change from true to false)
- Open “Modules” window
- Right-click on
Episerver.dll(I checked thatXhtmlStringcomes from that library) and chooseDecompile source to Symbol File
The above steps allowed me to place breakpoints and actually hit them!
Option 2: use JetBrains dotPeek as a decompiler
I’ll share an alternative approach using the dotPeek decompiler. Some people say it works more reliably. I have no opinion yet, as I rarely do decompilation. Also, I have only used dotPeek so far, so I cannot compare. The steps, in addition to the ones described above, are:
- Install JetBrains dotPeek
- Open dotPeek
- Click “Start Symbol Server”
- I chose “All except .NET Framework assemblies”
- In dotPeek
Options -> Symbol Serverfind the URL of your local symbol server. This will be something likehttp://localhost:33417/ - In Visual Studio, go to
Tools -> Options -> Debugging -> Symbols, and add the above URL as a symbol server (ensure it’s enabled) - In Visual Studio’s Modules window, find the DLL that you want to debug and select
Load symbolsfrom the context menu. Select and let dotPeek generate PDB.

Summary
I was pleasantly surprised to learn that even when we work with closed platforms in Visual Studio 2022, we have free debugging tools that make it very easy to decompile and debug third-party code. I recently used dotPeek (option #2) to find a problem in Optimizely CMS code, and the debugging experience was excellent.
Good luck, and I hope you do not use this knowledge too often! 😊
No comments yet, you can leave the first one!